If you use Comsol Multiphysics – RF Module, you may have noticed that there is a far field option when you edit any Boundary settings. This feature will allow you to compute the scattered far field of an object using some tricks.
Initial Setting : Simple simulation using Comsol
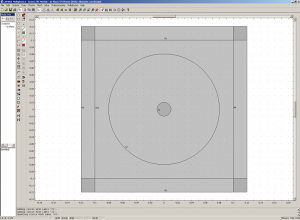
This tutorial will allow you to compute the scattered field of an ideal magnetic conducting circle in 2D. First, let’s design a square with PML around to absorb the outgoing light. Create a problem using Plane TM waves (we will change this latter to scattered TM waves, but the tutorial was made for an initial TM problem, and not for Scattered TM). We will assume you know how to use Comsol as a beginner user, so you know how to design the following structure :
- a square centered in (0,0), of length 0.2
- 4 additional rectangular borders to this square, of thickness 0.02
- a centered circle of radius 0.01
- a centered circle of radius 0.8
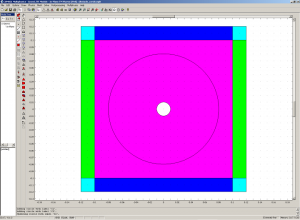
Now you should modify the design a little bit in terms of properties. First, select the big circle, and transform it to a curve (“Coerce to curve”). You should also remove the small circle from the main substrate to latter change its properties. In order to do that, select the small circle and the main square, and click on “difference”. Then, add some cartesian PML to the 4 rectangles : Physics > Subdomain settings > select the areas > PML > Cartesian > Try to figure out which PML you need to inser (left/righ absorb along x, top and bottom along y, corners along x and y directions)).
The following image shows the resulting construction. In order to highlight the construction I changed my Options > Preferences > Visualization, and checked the “Render Face” button.
Collecting the Far-Field
In order to collect the far field using Comsol Multiphysics, you need to change some “Physics” values. First, let’s explain what will be our simulation case. A plane wave will come from the inner-left boundary of the small square. We will use TM waves, with Hz=1 A (magnetic field) emerging from this inner boundary. So the source is located on x=-0.1. We thus need to indicate this to comsol. Go to Physics > Scalar variables > Change the value of H0iz_rfwh to exp(-j*k0_rfwh*(x+0.1)).
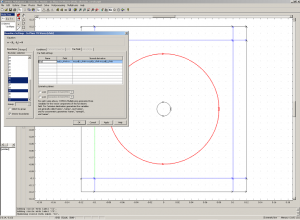
Now we need to indicate Comsol that we want to integrate the far field on the big circle we draw during the first step. Modify the Boundary settings to add a far fiel value, called Efar on the curves representing the circle.
Note that you just need to write the name of the variable Efar, and comsol will automatically create resulting variables.
Next you need to inser a relation to get Hfar from Efar. Indeed, we are looking at the magnetic field, Hz, and not at Ez. Go to Options > Expressions > Global Expressions. Add the following expressions :
- r : sqrt(x^2+y^2)
- Hfar : (x/r*Efary-y/r*Efarx)*sqrt(epsilon0_rfwh/mu0_rfwh)
Now you are almost done. To get a better scattered result, you need to change the way comsol solve the problem. go to Physics > Properties > change Field type to Scattered TM.
You can finally start the solving process.
Visualizing the scattered far-field
You can now visualize the scattered field in the Plot paramaters > Surface section (Scattered Magnetic Field, z component). Nevertheless, the great feature is that you can now plot an angular far field plot using matlab.
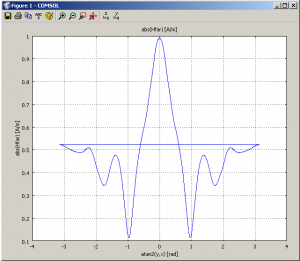
First, in Comsol, Postprocessing > Domain Plot Parameters > Line/ Extrusion > select the big circle’s curves. In the y-axis data, change the expression to abs(Hfar). In the x-axis data, select “Expression” and inser the following expression “atan2(y,x)“. It is used to display the data along the circle, using an angular representation. Clik Ok, you should get something similar to the following.
In order to visualize this with Matlab, click on th ASCII button, and save the plot data on your computer. Let’s call it scat_circ.txt. Open Matlab. Import this data : File > Import Data > select scat_circ.txt (then Next , then Finish).
Now, just use the following command lines :
- scat_data=sortrows(scatt_circ);
- rho=scat_data(:,2);
- theta=scat_data(:,1);
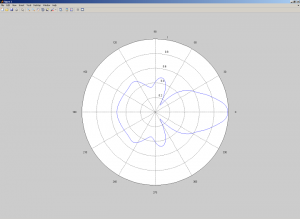
- polar(theta,abs(rho))
You should get the resulting :
To follow : You can also compared the resulting field with a theoretical diffracted circle. In the following article, I will explain how to compute the scattered field of a circle theoretically.
