
Almost every leadership team has a recurring meeting, whether it’s called an executive committee, a leadership sync or a business review. In this post, we’ll go through the most popular formats for running it, what each one does well, and where they differ, to help you challenge the way your company runs its exec meetings today.
What's a "Weekly Business Review"?
A Weekly Business Review (WBR) is a recurring leadership meeting built around a fixed set of business metrics: owners explain what moved, the team decides what to do about it, and actions are checked at the next session. The name comes from Amazon, but it’s used here for any recurring leadership review, whatever its cadence. Ours ran every two weeks.
For several years at 52 Entertainment, I attended our leadership meeting every two weeks, alongside the rest of the executive committee (the CEO, CFO and COO, among others). We had a PowerPoint template with a slot for each of us: one part reporting on our standard KPIs, one part updates on initiatives and blockers. If I’m honest, it wasn’t a very efficient meeting. Lots of preparation, lots of reporting, not that many decisions.
So before sharing what I’d do differently next time, I went looking at how the best-known methods approach the problem. They don’t agree on everything: cadence, meeting length, the number of metrics and the place given to goals all vary from one method to another. But they all assume something they don’t really teach: that you already know which numbers deserve to be in the room. In my experience, that’s where most of the value (and most of the work) is.
But first, let’s look at the most popular meeting frameworks.
Five ways to run the meeting
Amazon’s Weekly Business Review (WBR). Described in Working Backwards by former Amazon executives Colin Bryar and Bill Carr, the WBR is the reference most operators cite. Its core idea is to separate output metrics (revenue, profit) from controllable input metrics: the things a team acts on directly in its day-to-day work, like selection, price or delivery speed. Manage the inputs and the outputs follow.
The meeting itself is 60 minutes (90 during the holiday season), and every senior executive attends. It runs on a static deck of 400 to 500 metrics, printed in the early years, with four charts per page. Each chart shows the trailing six weeks next to the trailing twelve months, with last year and the target on the same graph, so a trend and a one-off are easy to tell apart. A facilitator, usually from Finance, opens with the follow-ups from the previous week. Then the deck is read in a fixed order, and no metric is skipped: each owner speaks to their own chart. If it shows nothing unusual, the owner says “nothing to see here” and the room moves on within seconds. Strategy and problem solving are not allowed in the meeting; they’re taken offline.
EOS’s Level 10 Meeting. A very popular format among small and mid-sized companies, coming from Gino Wickman’s Traction. Same 90-minute agenda every week: a short check-in, a 5-minute Scorecard of 5 to 15 numbers (each owner says “on track” or “off track”, no discussion allowed), a quick review of quarterly priorities (“Rocks”), headlines, last week’s to-dos, and then 60 minutes of “IDS”: Identify, Discuss, Solve on the top three issues. Anything off-track during the reporting part drops into the issues list instead of being debated on the spot.
What's a "scorecard"?
A scorecard is a short, fixed list of the numbers a leadership team reviews at every meeting. Each line has one owner, a target, and the actual value for the period, usually shown over the last few weeks (EOS uses a rolling 13 weeks) so trends are visible at a glance. Unlike a dashboard, which tries to show everything, a scorecard is deliberately small (EOS recommends 5 to 15 numbers) and is read as on track or off track.
The term is used most explicitly in EOS, but every format in this post has one in some form: Amazon’s WBR deck, the key results in an OKR check-in, or the “few key metrics” in Lencioni’s tactical meeting.
Radical Focus (OKR check-ins). Christina Wodtke’s answer to “how do OKRs actually get done?” is a weekly rhythm: Monday commitments, where leaders review their confidence on each key result and commit to the week’s priorities, and Friday wins, where teams show what they shipped. She’s explicit about status updates: “Have fewer priorities, shorter updates.”
Lencioni’s meeting types. In Death by Meeting, Patrick Lencioni argues that most leadership meetings fail because they mix everything together. He separates a short weekly tactical meeting (a lightning round, a quick look at a few key metrics, then an agenda built in real time from what came up) from a monthly strategic meeting for the big topics, and a quarterly off-site review.
The North Star Framework. Not a meeting format, but the most useful companion to one. Amplitude’s North Star Playbook asks a team to pick one North Star Metric plus three to five input metrics: the factors that, together, drive the North Star, and that the team can move directly through its work. Two details matter here. First: “If you can move your North Star directly, it’s probably not a good North Star” (John Cutler). Second: a company with several distinct P&Ls can have several North Stars.
Here’s how they compare:
| Amazon WBR | EOS Level 10 | Radical Focus | Lencioni | North Star | |
|---|---|---|---|---|---|
| Cadence | Weekly | Weekly, 90 min | Weekly (Mon + Fri) | Weekly tactical + monthly strategic | Reviewed weekly to quarterly |
| Time mostly spent on | Walking through metrics, exceptions only | Solving the top 3 issues | Commitments and confidence | Tactical: live agenda. Strategic: one big topic | — (defines what to watch) |
| The numbers | Hundreds, inputs vs outputs | 5–15 scorecard numbers | Key results + 2 health metrics | A handful of key metrics | 1 North Star + 3–5 inputs |
| Where goals live | Financial plan, reviewed every meeting | Quarterly Rocks, on/off track weekly | OKRs, every week | Monthly / quarterly | Inputs map to the work |
| Best fit | Data-mature orgs with automated reporting | SMBs wanting a simple, repeatable discipline | Teams already running OKRs | Teams drowning in mixed-purpose meetings | Product-led businesses |
| Watch out | Heavy to stand up without solid data foundations | Assumes you know what goes on the scorecard | Weekly OKR talk can crowd out operations | Needs discipline to keep strategy out of the weekly | One metric per P&L, not per company |
Where they disagree
Cadence. Most methods say weekly. But the rhythm should match how fast your levers move. If nothing the team does this week can change a number by next week, there’s little point in looking at it every week. What matters more is that the meeting never skips, so people trust that what’s raised will come back.
Goals and OKRs. Wodtke wants an OKR check-in every week. Lencioni and the Lucid Meetings “dual cadence” approach push strategy into a separate monthly slot, while EOS takes the middle road: a 5-minute on-track/off-track check on quarterly Rocks, with the real discussion happening quarterly. I lean towards the middle road. At 52 Entertainment, I ran OKRs inside the data team, and the company was moving towards company-level OKRs when I left. A regular update on them in the leadership meeting is useful, but not every time. A full OKR review in every session turns an operating meeting back into a status meeting.
Where they all agree
Strip away the branding and the methods converge on three rules:
- Report fast, solve slow. Whether it’s Amazon’s “nothing to see here” or EOS’s “no discussion during the Scorecard”, reporting is kept short and silent. The time goes to the few things that moved.
- One owner per number. Every metric has someone who can explain why it moved and what they’re doing about it. Without that, metrics get narrated by whoever is loudest.
- Close the loop. EOS reviews last week’s to-dos at the start of every meeting; at Amazon, an unanswered question becomes a follow-up within a day. A decision that isn’t checked next time wasn’t really a decision.
Looking back, our template broke the first rule. One slot per person, mostly reporting, meant the meeting spent its best energy on updates that could have been read beforehand.
The hard part: choosing numbers with a lever
Here’s what none of these formats does for you. You can get a number for almost everything, but only a few of them can drive real business change. Most dashboards are a mix of three kinds of metrics:
- Vanity metrics, which go up and make everyone feel good (total downloads, total registered users, raw revenue in some businesses).
- Curiosity metrics, which are interesting to look at but that nobody would act on if they moved.
- Lever metrics, the ones a specific person can move this month, and which actually drive the outcomes the company cares about. Amazon’s controllable inputs, Amplitude’s North Star inputs, and the classic “leading indicators” are all names for this category.
A leadership review should run almost entirely on the third kind. The difficulty is that you rarely know which ones they are upfront.
At 52 Entertainment, our two main businesses worked in completely different ways. One relied heavily on real-world partnerships and competitions. The other was 100% driven by paid acquisition. For the second one, tracking revenue alone was misleading: you can grow revenue while burning money on ads. Margin and ROAS (return on ad spend) were the numbers that actually told us whether the business was healthy, and the ones its team could act on. For the first business, those same metrics were almost meaningless. A single “company revenue” slide hid both stories.
Getting the whole board to read each business through its own levers took several sessions. And I think that’s normal: the team has to iterate its way to its north star metrics, and own them. Amazon’s own alumni say the same about input metrics: you get better at choosing them through trial and error, and the metric set is expected to change as some inputs stop moving the outputs.
A few questions help sort the list:
- Would anyone act if it changed? Imagine this number drops by 20% next week. If nobody in the room would do anything differently, it belongs in a monthly report, not in the review.
- Who owns it? If nobody can explain a change, it’s not ready for the leadership meeting.
- Does it move week to week (or meeting to meeting)? A number that’s flat for a month trains people to stop looking.
- Is it a lever for this business? In a multi-business company, the scorecard is rarely the same for everyone.
This is also why the leadership review can’t be the only layer. At 52 Entertainment, each business unit had its own regular meetings, and as Head of Data I joined at least one of them every month, for each business unit, alongside its VP, Marketing Manager and Product Director. Their purpose was as much cultural as operational: making sure each management team knew the health of its business, and building the right curiosity about KPIs. The leadership review only works if those layers below it have already done the work of finding their levers.
Let AI do the preparation and the follow-up
The other reason our meeting felt heavy was preparation. Every attendee had to pull numbers, build slides, and collect initiative status before every session. All the methods above ask for that preparation to happen before the meeting, so the meeting itself can be spent solving. In 2026, most of that work no longer needs a human.
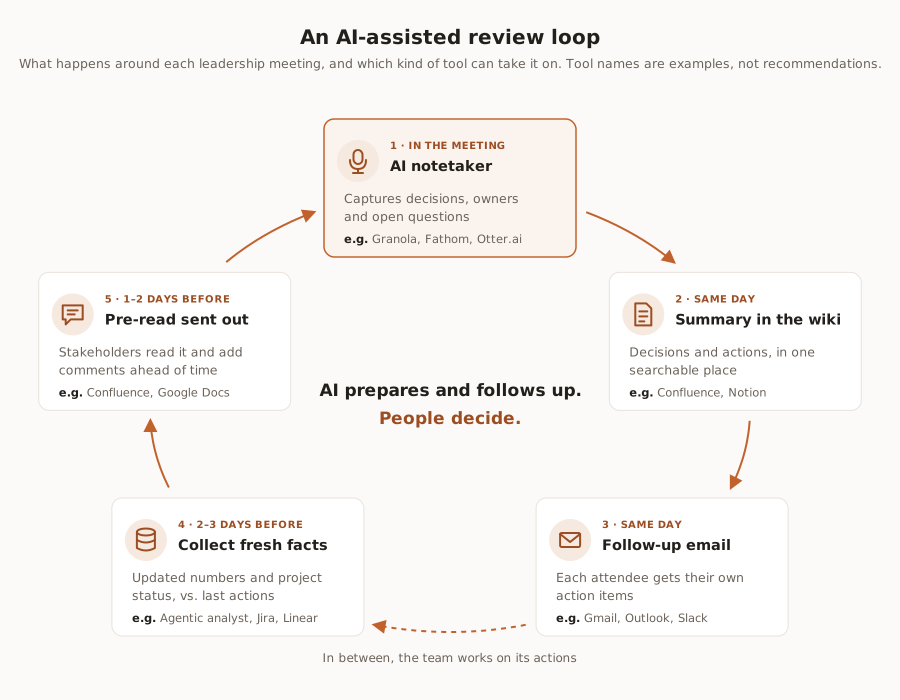
One caveat. Automating the preparation makes a bad scorecard cheaper, not better. If the numbers in the pack aren’t lever metrics, or if two teams compute them differently, an agent will produce the wrong pack faster. Choosing the metrics stays a leadership job.
What my next leadership review will look like
The next time I set up a leadership review, I’ll start from an existing format rather than a homemade template (EOS Level 10 is the easiest to adopt). I’ll spend the first few sessions arguing about the scorecard rather than reading it, separately for each business, until every number on it has an owner and a lever. I’ll move OKRs to a periodic slot instead of every meeting. And I’ll let AI take the preparation and the follow-up, so the people in the room spend their time deciding.
If you’ve never seen a structured leadership meeting in action, EOS has a short walkthrough of the Level 10 agenda:
How does your leadership team run its review? And if you looked at your current scorecard today, how many of those numbers would pass the “would anyone act on it?” test?
References
- Colin Bryar & Bill Carr (2021) — Working Backwards: Insights, Stories, and Secrets from Inside Amazon. Origin of the WBR as described above; see also their concept page Input metrics & weekly business review, source of the controllable input vs output distinction and the trial-and-error point.
- Cedric Chin / Commoncog — The Amazon Weekly Business Review (WBR). Detailed practitioner breakdown: “nothing to see here”, metric owners, and why the metric set isn’t static.
- Basedash — How to run a weekly business review (WBR): a practical operating guide. Practical criteria for which metrics belong in a WBR, and the WBR vs monthly vs board review comparison.
- EOS Worldwide — What is a Level 10 Meeting?. The full 90-minute agenda: Scorecard, Rocks, To-Dos and IDS. Based on Gino Wickman’s Traction.
- Ninety — What Is a Level 10 Meeting? The EOS Weekly Meeting Explained. A coach’s view on preparing before the meeting so the team arrives ready to solve.
- Christina Wodtke — Monday Commitments and Friday Wins. The weekly OKR rhythm from Radical Focus.
- Patrick Lencioni (2004) — Death by Meeting. Weekly tactical vs monthly strategic meetings.
- Lucid Meetings — The 4 Meeting Agendas that Drive Strategic Execution. The operational vs strategic “dual cadence” for leadership teams.
- Amplitude — The North Star Playbook: About the North Star Framework. One North Star plus a few inputs, and why multi-P&L companies can have several.
- Mixpanel — What is a North Star metric?. Metric trees: breaking a focus metric into actionable input metrics.
Hero image by Vlada Karpovich on Pexels.